Week 1 - Making a Race Exciting
Week 1 - Making a Race Exciting
News/Introduction
For our first week in our Physics unit, we are thinking about different things that children do while at the park. One such important thing we talked about is how the playground equipment has an important role in the overall design of the park. Some questions we developed as a class were:
- What makes the playground "fun?"
- What materials should we use when designing our playground?
- What other factors do we need to consider when we design a playground (safety, location, etc.)?
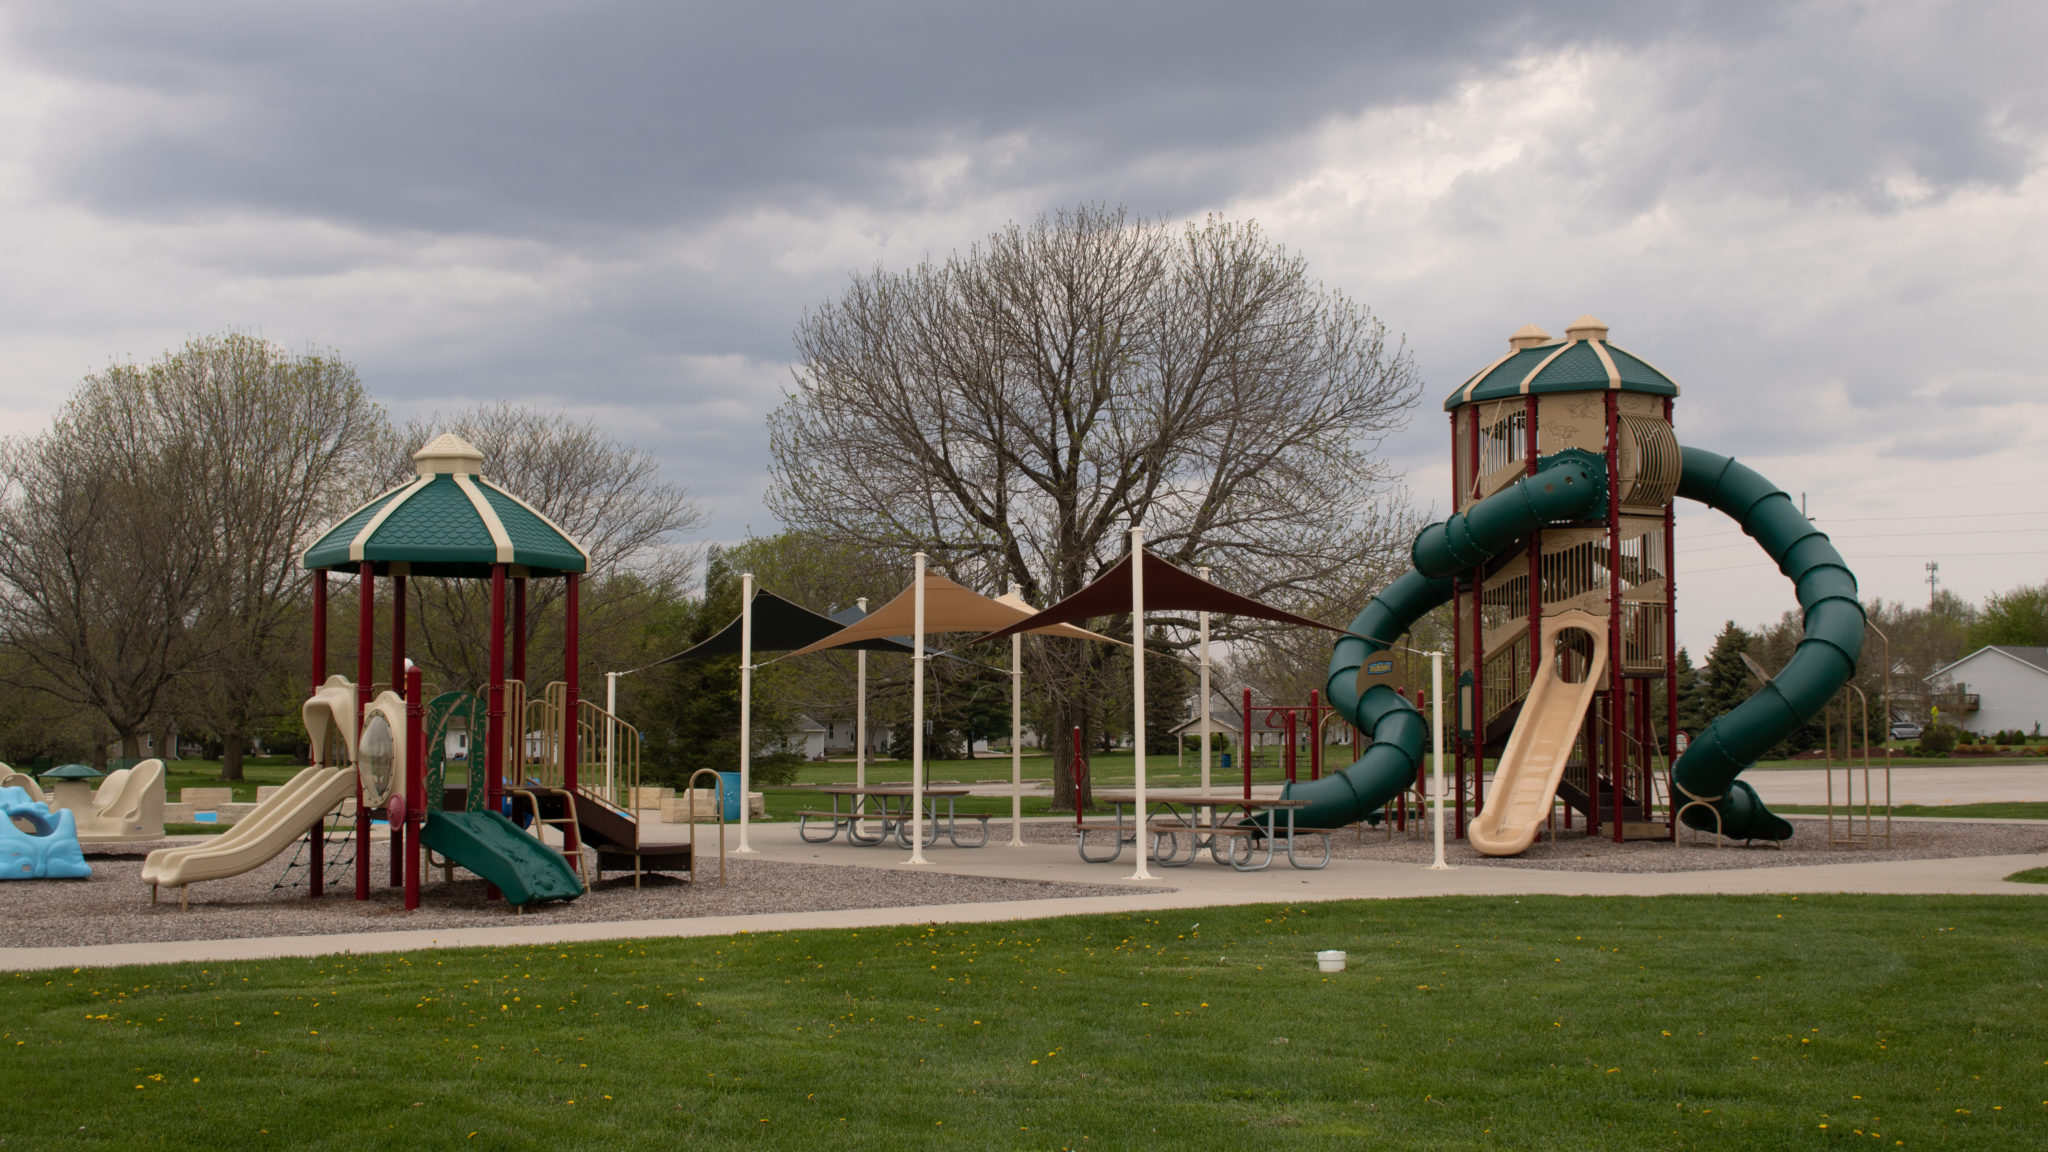 |
| How can we make this playground "fun?" |
During our discussion, we explored one thing that is commonly seen on the playground. Children love to race to places or things. As a result, our discussion led to us asking another key question:
How can we make a race exciting?
But what defines "exciting?" Our class came up with a big idea to make the race exciting. This race has to be close. You want to be on the edge of your seat for the finish, trying to guess who is going to win. I am a big fan of the television show "The Amazing Race" and the number of times where a finale episode becomes unexciting is too many to count. I want to watch a race for a million dollars where the two teams are extremely close (for a good example of this, watch the finale of The Amazing Race 2, where the winner was decided by a matter of seconds).
New Discoveries
In our laboratory experiment, we tested a variety of "race conditions" that could make this race exciting. We started out by setting our control* which was a race in which racers started at the same time, and one racer easily defeats the other other racer. From there, we thought about conditions to help make the race exciting - what can we do to make the racers finish the race as close as possible?
*control - an experiment where no conditions are altered for comparison with other experiment modifications.
My group experimented with walking approximately 5 meters. Both racers walked at their normal pace and other group members recorded the time it took to walk the 5 meters. From there, both races walked to the finish line. We make calculations on the distance traveled and the time recorded to determine the racers' speed. The equation we used to determine the racer speed is:
 |
| s = speed (in meters per second), d = distance (in meters), and t = time (in seconds) |
When my group collaborated on making the race exciting we developed two variations for our race:
- Allowing the "slower" walker to start before the "faster" walker. - Timed head start
- Allowing the "slower" walker to walk a shorter distance. - Distance head start
When we ran (no pun intended) the trials to make the race more exciting, we noted that the racers will finish at the same time (or close to the same time)! How did we determine this?
We had two volunteers, J and K simulate a race in the classroom. We found that J walked at a pace of 2.95 m/s (meters per second), and K walked at a pace of 1.74 m/s. If each person walked 6 meters, how long did it take for each person to finish the race? We can use a little bit of algebra to get our answers!
 |
| Time calculations for J and K |
From these calculations on the left, we can see that J (in purple) will finish the race faster than K (in red). We can also see that J will finish the race faster than K will finish by approximately one second. For our second simulated race, we allowed K to have a one second head start, and lo and behold, both racers finished at the same time! But why did this phenomenon happen?
Connections
When we discussed this phenomenon in lecture, we took a look at another race between two people, John and Allie, as they raced 10 meters. How long did it take each person to finish the race?

From the calculations above, we see that John will finish the race faster. We also discussed why the race would be more exciting with a timed head start or a distanced head start. We talked about the idea of modeling motion with graphs. This gives us another way to look at our discovery. We can model our original race with a simple graph.

From this graph we can see the same results as our calculations. But, we are allowed to move the graphs to model a timed head start, or a distanced head start.
 | ||||||||||||||
| Race modification - John starts 1 second after Allie |

Notice that the speed graphs are linear! From this connection to speed, distance, and time, we can see that we can use graphs or math to help us make races exciting to watch!
The Future
When we look at what we learned through our lab experience along with what we learned about speed in lecture, we came up with a couple of questions that could change the results of our race:
Using these questions and our new found knowledge on speed, we can find ways to make further modifications to make our races as exciting as possible! Now that we have talked about making a race on the playground, we can look at another popular playground feature - slides!

Comments
Post a Comment